Vizlib Extensions for Qlik
Bring more power to your Qlik environment with Vizlib extensions.
As a trusted Vizlib partner, Climber offers a comprehensive range of these extensions to meet your business needs.
What is Vizlib?
Vizlib’s value-added extensions for Qlik Analytics enable you to power-up your visualisations and dashboards.
The advanced capabilities give you complete control over all the design elements of your reports and enable you to add smart, customised functions and visualisations.
Vizlib’s extension packages
Vizlib Library
A diverse set of customisable visualisations that enhance user interface design, enabling the creation of intuitive and engaging dashboards without the need for coding.
Vizlib Self-Service
Empowers users across your organisation by promoting data literacy and making data accessible to everyone, facilitating informed decision-making at all levels.
Vizlib Finance
Designed for financial reporting, this extension enables you to create dynamic profit and loss statements, balance sheets, and cash flow reports, complete with real-time commentary.
Vizlib Collaboration
Elevates organisational communication by integrating collaborative capabilities directly within Qlik, fostering transparency and streamlined workflows.
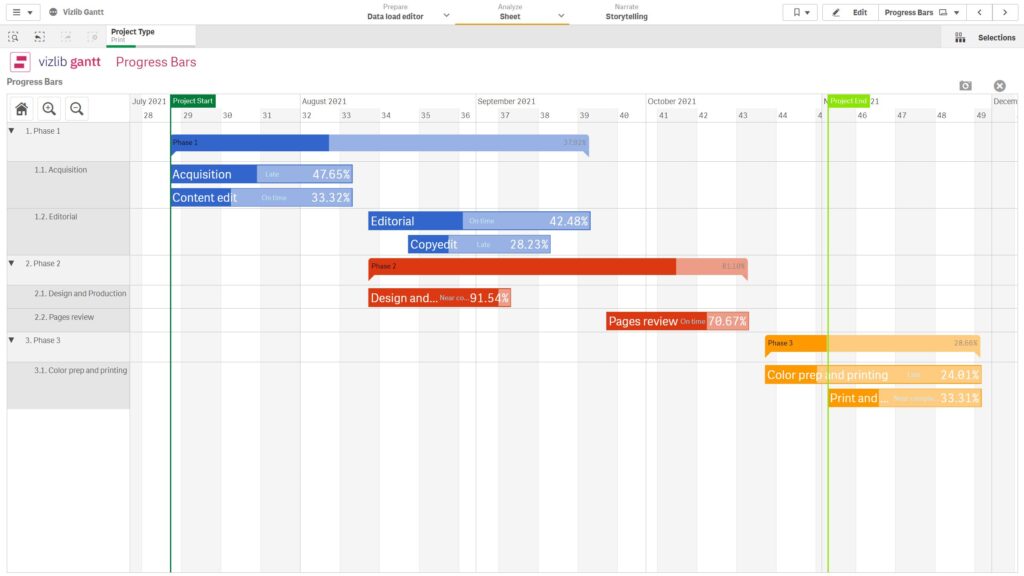
Vizlib Gantt
Assists in project management by providing detailed Gantt charts to help keep your projects on track and visualise timelines effectively.
Unlock the power inside your data with Vizlib Hidden Insights AI
Your dashboards already tell a story – but what if they’re only showing half of it? Vizlib Hidden Insights AI takes your Qlik data further, revealing the patterns and opportunities that hide beyond your filters.
No exports. No developers. Just instant, intelligent analysis built right into the Vizlib experience.
Discover what your dashboards are missing!

How to get started?
The Vizlib product trial is free of charge for up to five users. It allows you to use all Vizlib products within the Qlik environment, regardless of your user role.
Ready to find out more?
Dive into the details of each extension
BASIC CHARTS
Includes Pie, Scatter, Combo, Line, and Bar charts, as well as the most popular dashboard functions such as reference lines, HTML tooltips, support for alternate states, customisable backgrounds, and more. You can also access advanced analytics capabilities including forecasting and clustering.
ADVANCED CHARTS
Create dynamic, interactive dashboards and raise the bar on style and functionality. Includes extensions such as Sankey Chart, KPI Designer, Activity Gauge, Heatmap, Story Timeline, Venn Diagram, and Mekko Chart.
COMPONENTS
These smart components provide rich styling and formatting options to help you create a neat, well-organised dashboard. Components include extensions such as Slider, Calendar, Advanced Text Object, Filter, and Line Object.
NAVIGATIONAL ELEMENTS
Sheet menu enables you to move with ease between Qlik visualisations, individual diagrams, as well as dashboards.
Container Grid helps you organise your diagrams in an optimal way and elevate your user-experience to new heights.
TABLES
The pivot table and straight table have a host of dynamic formatting options to give you the power to arrange and visualise your data in a way that is easy to read, analyse and act upon.
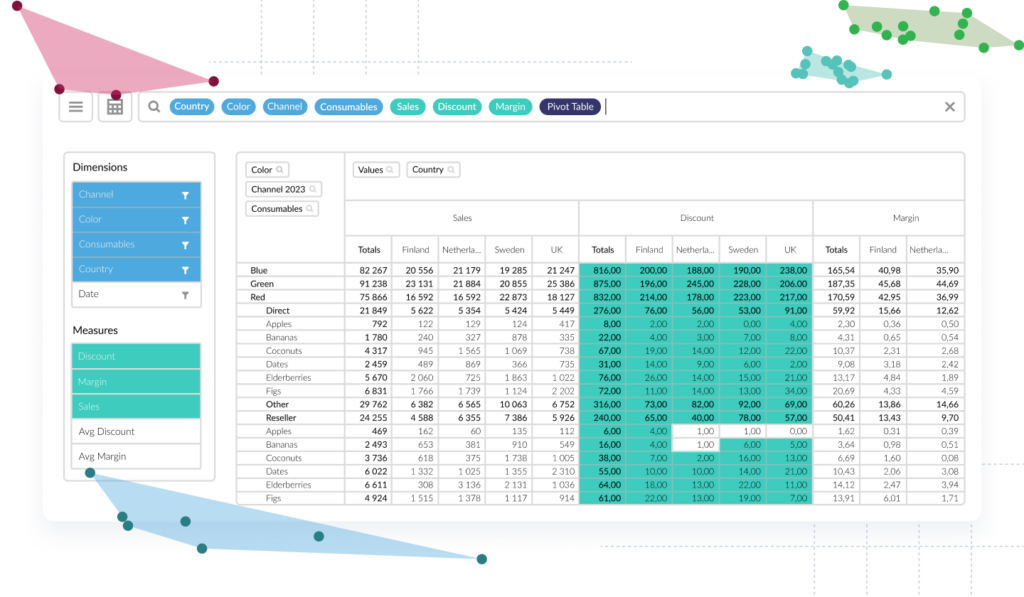
CUSTOM REPORT
Create dynamic tables and pivot tables, based on data in master tables. Easily select your dimensions and measures and move columns and rows to create the view you need without having to click on the edit button.
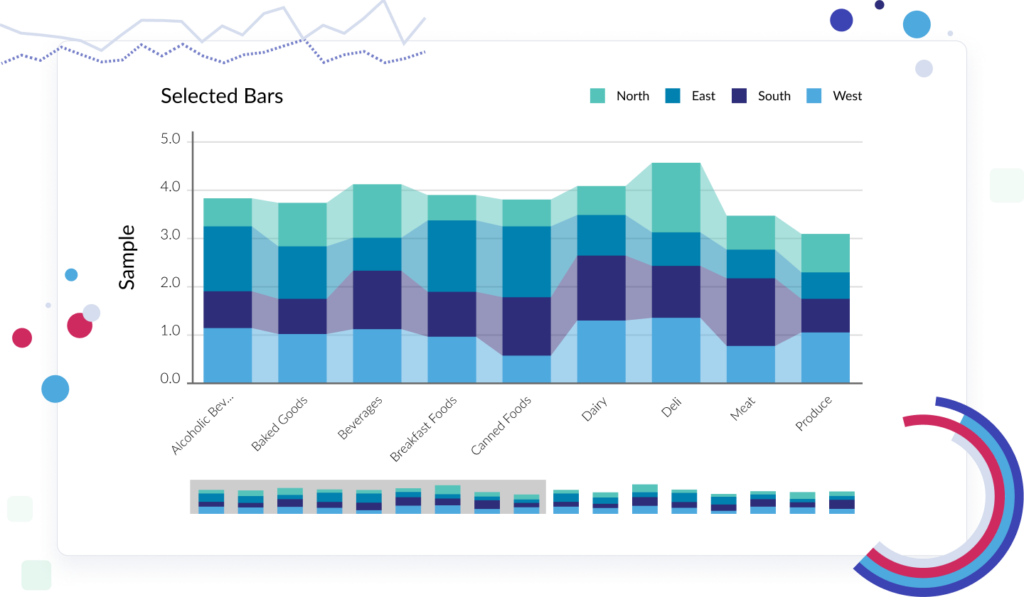
SELECTION BAR
This horizontal selection bar has pre-selected values that allow fields, variables and flags to be displayed. You can also link to other Qlik documents, set variables, and select dates quickly.
KPI EXTENSION
Configurable colours and trends make it easy to compare target to actuals over time. It is fully responsive and makes it easy to navigate between your dashboard and details on other sheets.
CONTAINER BOX
Gives you the option to include alternative objects in the same space. Select with ease the objects you want to show via menus or icons.
CARDS EXTENSION
Make your lists and tables more dynamic and visual by adding images of products, logos, or even people.
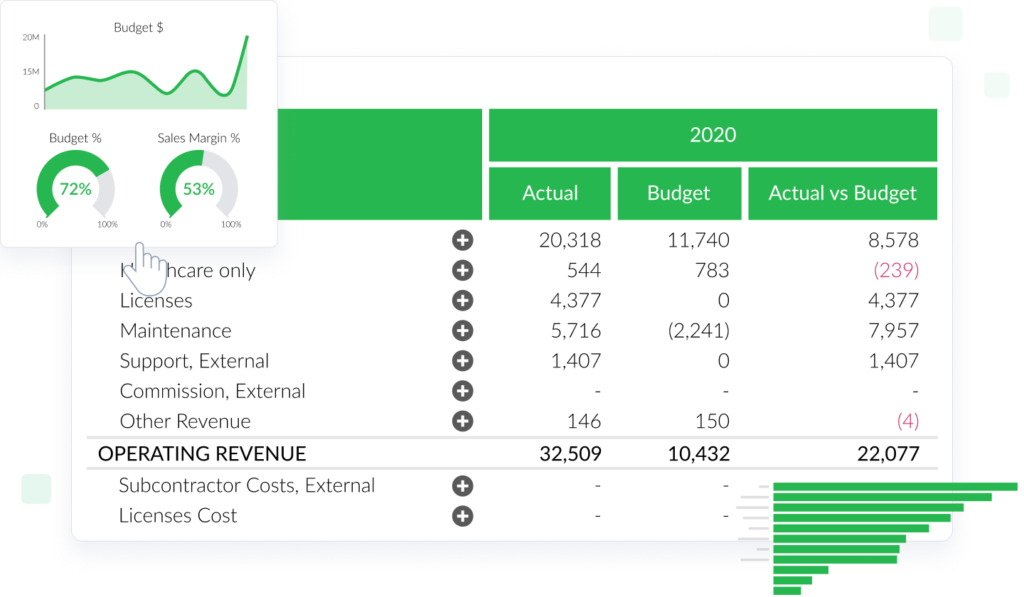
VIZLIB FINANCE
Delivers P&Ls and balance sheets with advanced formatting and customisation functionalities to help you create smart and engaging reports.
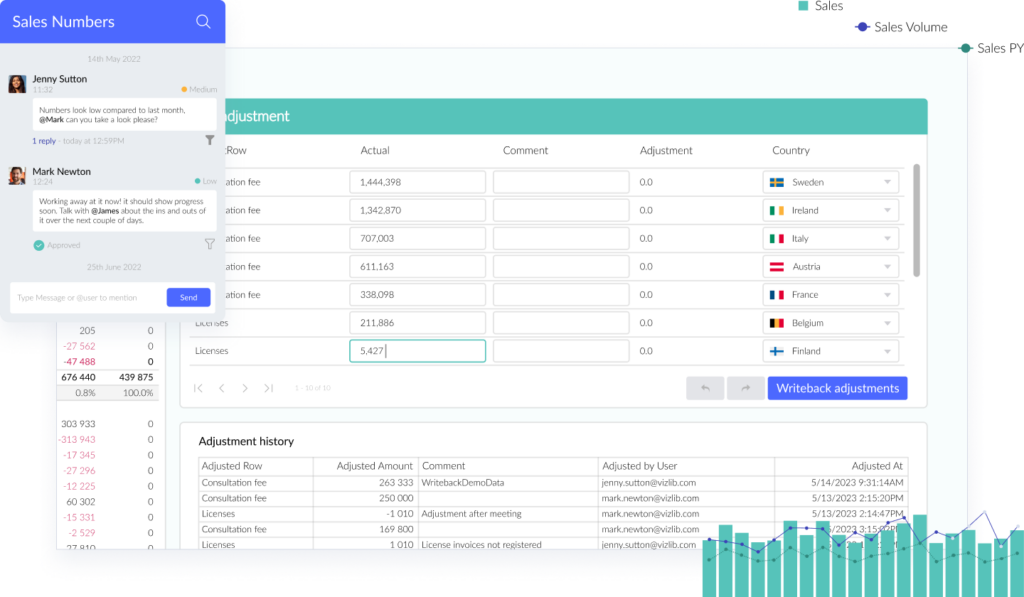
REAL-TIME COMMENTARY
Add real-time comments to your reports. The set-up is completely secure and allows multiple levels of reporting.
VIZLIB TEAMWORK
Keep all relevant communication in one place, chat to colleagues, and gather feedback in real-time. Share comments and send notifications with a chart reference via email, Slack, or Teams.
VIZLIB INPUT FORM
Collect user input and add new datapoints into your already published Qlik applications. Send dynamic data to almost any business tools from another system, such as your CRM, email, or Slack.
VIZLIB WRITEBACK TABLE
Smoothly edit, update, and comment directly in your dashboards while staying in the analysis flow. You can edit Qlik’s dimensions and measures, and seamlessly add new data using dropdowns, free text fields, radio buttons, tags, and many more options.
PROJECT PLANNING
Keep track of projects by using dynamic markers or milestones and maintain a 360 view of the timeline, no matter how complex it is. Use visual reports to quickly understand dependencies between activities and prioritise correctly.
VISUALISE THE PROCESS
Get a start-to-finish view of complex data flows and process steps, so you can discover bottlenecks and predict risks, such as customer churn, delayed payments or deliveries.
RESOURCE PLANNING
Keep track of how your resources are allocated, who’s got the bandwidth to step in and support, and which tasks are stalling due to inadequate resource management.
360 OVERVIEW
View all critical milestones in a chronological order and get a full overview of the entire project.
TURN EVERY CLICK INTO A DISCOVERY
With one click on any Vizlib chart, Hidden Insights AI instantly compares key metrics to surface variances and relationships, explains your data in clear, natural language summaries, and uncovers hidden trends and outliers you might have missed.
It’s like having an analyst inside your dashboard, one who never stops asking “what’s really going on here?”.
SEE WHAT’S BEYOND THE FILTERS
Stop losing insight through exports and manual Excel work. Hidden Insights AI looks past what’s on screen to find value in your unseen data – alerting you to regional shifts, new trends, and unexplored opportunities before your competitors spot them.
BUILT FOR HOW YOU WORK
Hidden Insights AI works directly within your existing Vizlib Library, Self-Service, or Collaboration subscription. It works on any dashboard with no rebuilding required, it can handle large datasets with ease, and it’s secure with session-based analysis. Best of all, you can run Hidden Insights on-premises or in the cloud.
WHO BENEFITS
- BI & IT Teams reduce dashboard change requests and empower users to self-serve.
- Finance Teams eliminate Excel models and get variance analysis instantly.
- Business Leaders can make decisions with the full picture, not just filtered views.
- Every Qlik User turn from a ‘viewer’ into an ‘analyst’ with no additional training required.
Sign up for a monthly subscription of Vizlib
With a monthly subscription you choose the package that best suits your needs.
Subscriptions include product support, updates, and all add-ons that are made to the package over time.
Installation
Once you’ve signed up for a subscription, the next step is installation. Vizlib’s value-added products are seamlessly installed via the Qlik Management Console.
Need help? Contact support@climber.se.
Support
Your subscription includes normal product support to ensure your extensions work seamlessly with new versions of Qlik Analytics. For on-prem environments, we support new versions at the time of their release or within a few days.
All support cases are managed via our ticketing system. Email your questions to support@climber.se.
Free Trial
Vizlib’s product packages are free to trial for up to five users. A Vizlib license covers all use cases for the named user and is equivalent to an assigned Qlik Token.
One Vizlib user license allows an individual to use all Vizlib extension products within the Qlik environment, based on their User ID, regardless of whether they are an app developer, app user, or end user.
Free trial, book demo, or learn more about Vizlib’s value-added extension products?
Please get in touch if you need more information about Vizlib or book a demo via the form below.
By partnering with Climber, you gain access to Vizlib’s powerful extensions, enhancing the versatility and usability of Qlik Analytics within your organisation.
Contact us today!