
How to measure BI success?
– Our Qlik Usage Survey gives you the answers!
It’s no secret that data-driven companies outperform their competitors. And while most companies use some form of BI solution today, many don’t know how to maximize their return on investment. While the answer is easy (by increasing employee engagement!), getting everyone on board is not. Climber recently conducted a survey among our customers to understand how they use BI and how we can help them get more out of their BI investment. According to the results, the key lies in boosting data literacy and BI self-service among employees.
So, why is data literacy so important?
Data literacy is the ability of employees to derive meaningful insights from data and use them in a way that benefits the organization. Self-service BI enables non-technical users to filter, sort, analyze and visualize data without involving the organization’s BI and IT teams. Basically, helping employees to help themselves.
»Data literacy is the ability to read, work with, analyze and argue with data.«
Dan Sommer and Olof Malmström will teach you how to speak the international language of data and how you succeed with data literacy, in this 2-minute video.

Want to learn more?
Sign up here and find out how to kick start your journey towards greater data literacy in your organization. View our webinar with Jordan Morrow, Head of Data Literacy at Qlik, where he focuses on the following issues:
- How data literate are you and your organisation?
- Why data literacy is crucial to your business performance?
- The characteristics of a data-driven culture.
- The importance of leadership and leading with data.
- How to jump start your data literacy strategy.
How data literate are you?

THE RESULTS OF CLIMBER’S QLIK USAGE SURVEY
Over the years, Climber has found that successful organizations establish data-first cultures that encourage the use of data, with strong support for the use of facts in decision making and a culture that celebrates curiosity and critical thinking. The most accurate measurements of BI success are engagement, adoption, its impact on decision making, and how well the solution fits the company’s operations. Taking a deeper look at this, we wanted to map out which factors have an impact on BI success using Qlik-based solutions and how we can help our customers get more out of their investment. The survey was sent to our BI contacts at customers in the UK, the Netherlands, Finland, and Sweden. Below, you will find a summary of the results and the main insights.
To all of you who took the time to complete the survey, many thanks. We highly appreciate your participation.
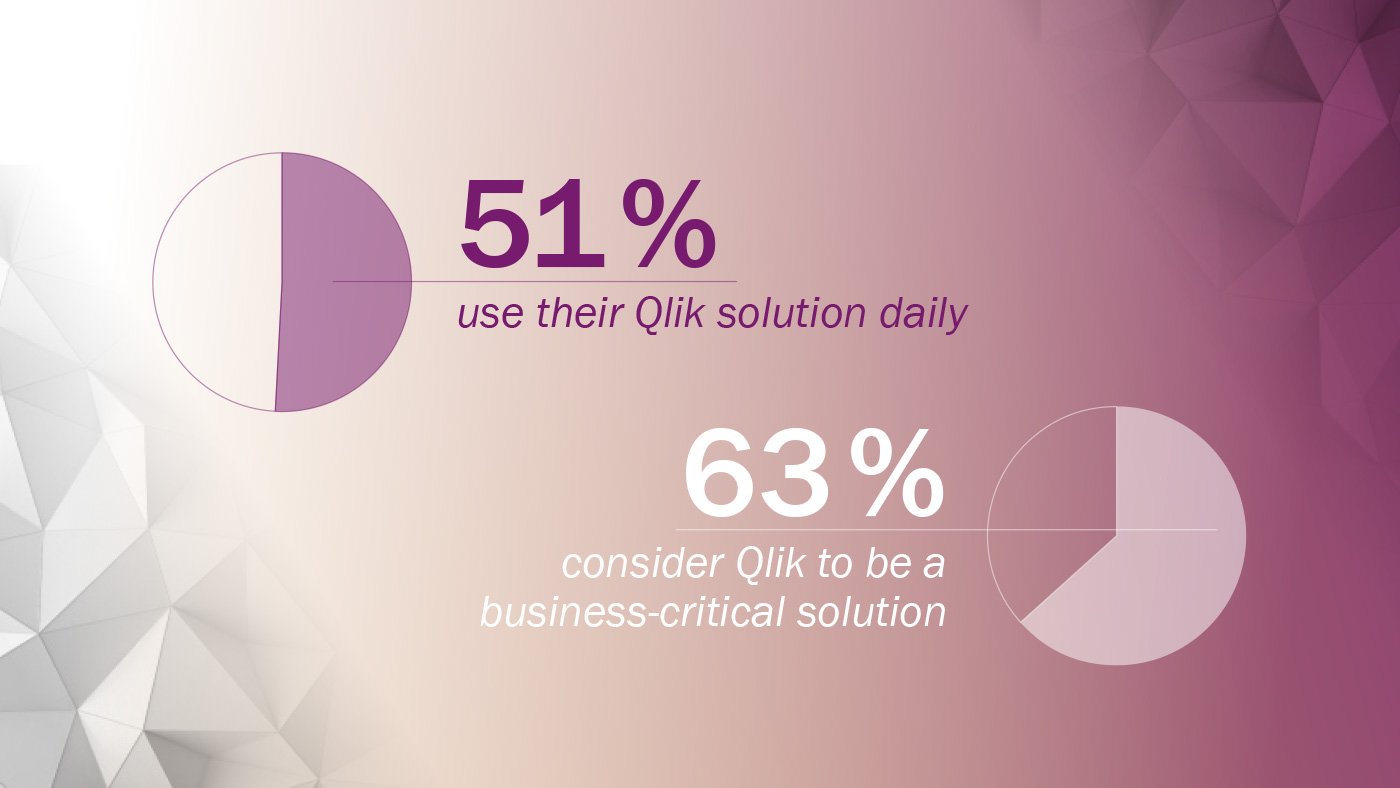
How much do you use your Qlik solution?
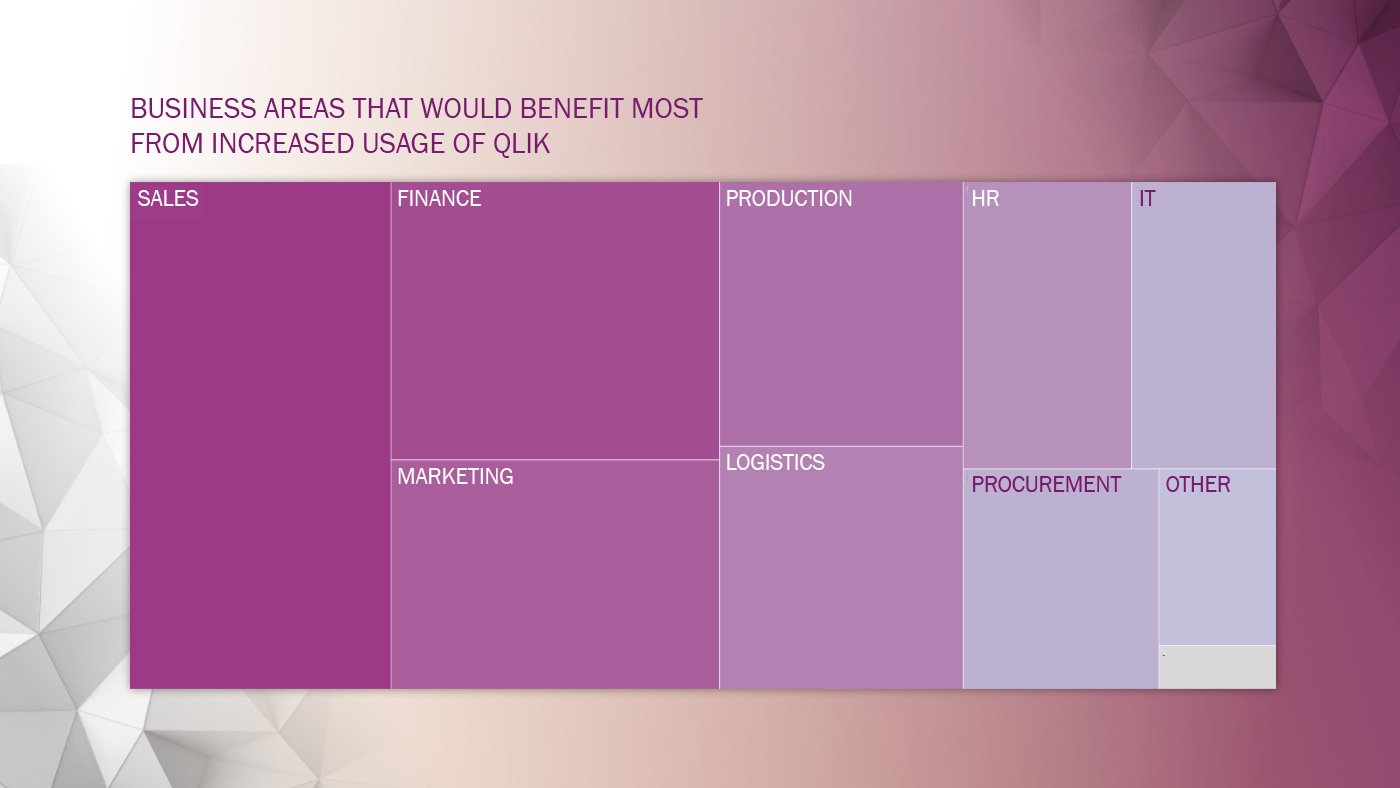
In the survey, some 63% of our respondents believed that Qlik is a business-critical solution and 51% use it on a daily basis. Some 41% said that better training would increase deployment of their solution, while 51% said that enhanced self-service functionality would attract more users. Top usage was seen in Sales (78%), followed by Finance (73%) and Production (44%). Survey respondents believed the areas that would benefit the most from BI usage going forward are Sales, Finance, Marketing, Production, and Warehousing & Logistics. Training and lack of interest were seen as the main barriers to the success of the solution.
Which factors impact on Qlik usage?
Key to our findings is that the most critical requirement for the success of any BI system is buy-in – from management and employees alike. Employee training and implementation of self-service tools are key. If employees are not trained in data literacy and how to incorporate and use these decision-support tools into their everyday workflow, then the best BI solution will not amount to more than a nice set of colourful graphs.
Overview of responding companies
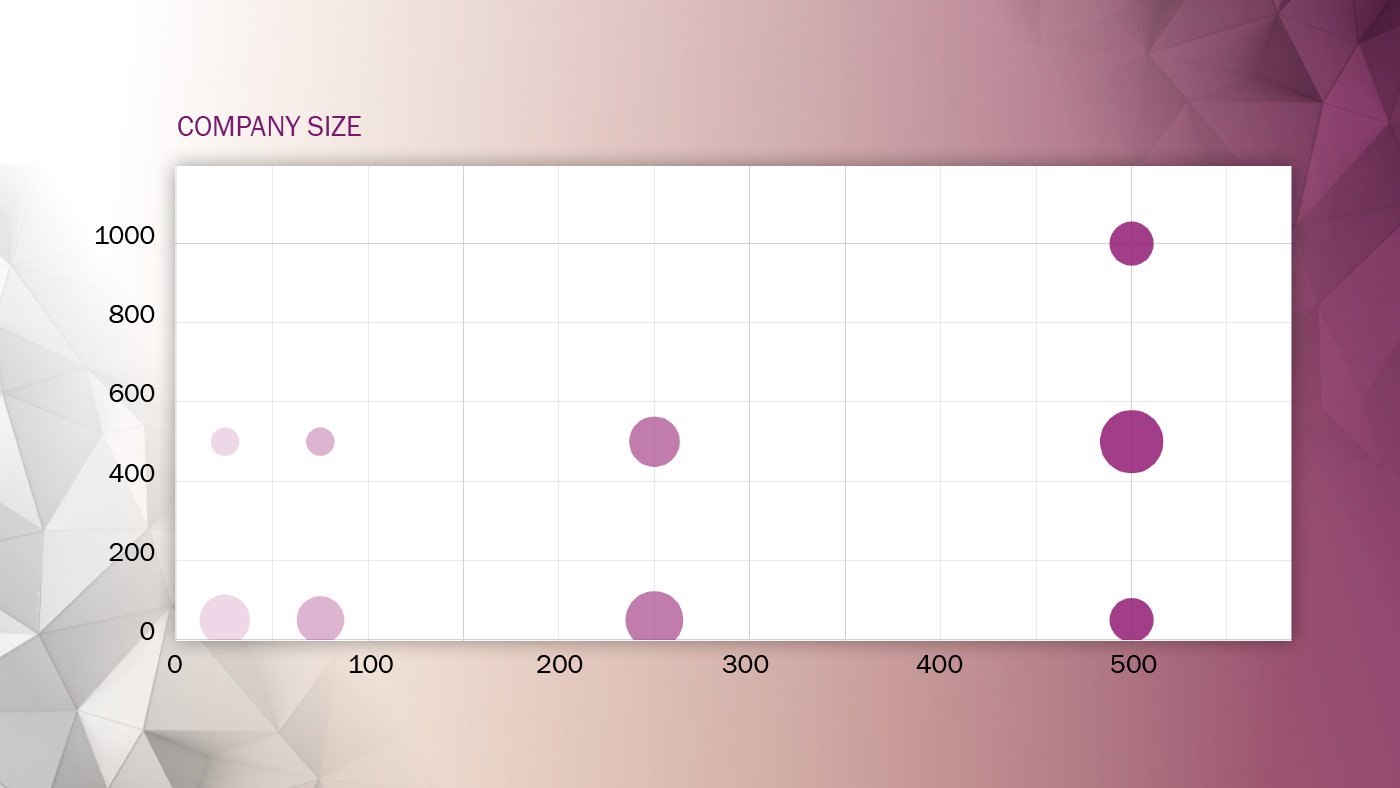
Size of respondent companies:
11 % have more than 500 employees and an annual revenue of 500 MEUR.
14 % have approx. 250 employees and an annual revenue of up to 100 MEUR.
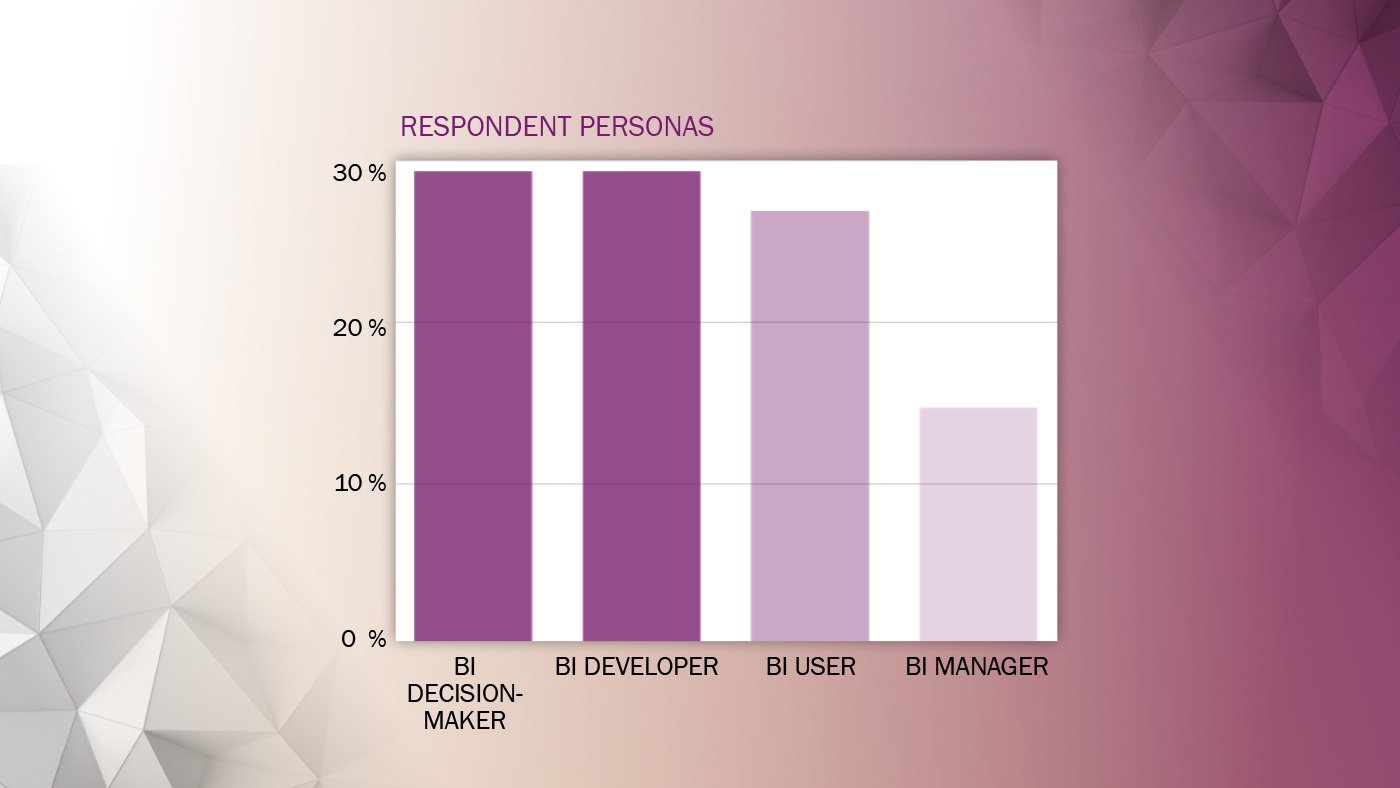
The respondents personas were:
BI Decision-maker: CEO, CFO, Director of Supply Chain, Director of Operations, Head of Controlling etc.
BI Manager: Business Intelligence Manager, Head of BI, Head of Data & Analytics, Business Development Manager IT etc.
BI Developer: Solution Architect, System Developer, Consultant, Data Scientist, System Specialist etc.
BI User: Business Controller, Data Analyst, Financial Controller, Business Developer, Analyst etc.
Usage analysis
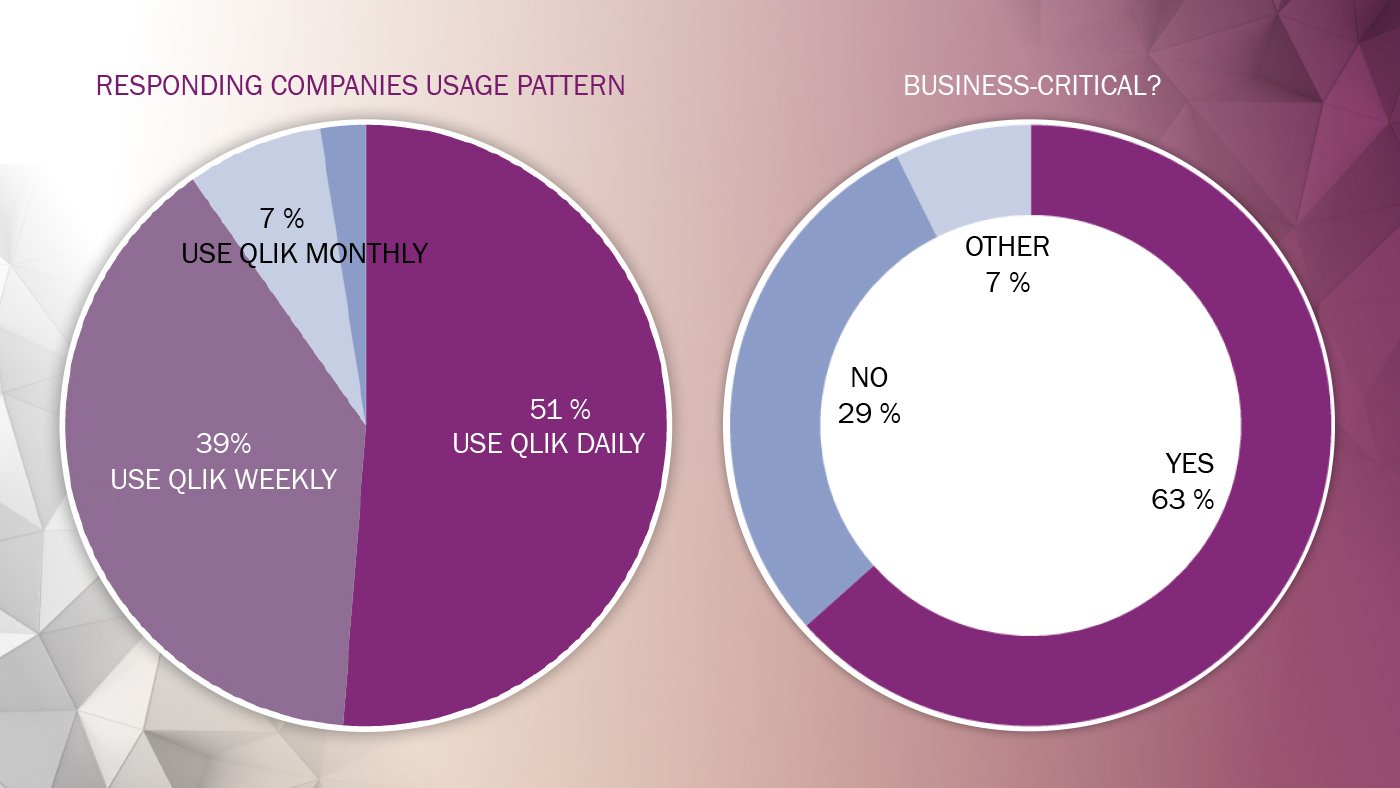
To 63 % of the companies, Qlik is a business-critical solution and 51% use it on a daily basis. 7 % commented that Qlik is a BI solution, both a complementary and a critical solution, or that it’s a complementary solution today but on its way becoming a business-critical solution.
The top 5 business areas that would benefit most from increased usage are:
1. Sales 61 %
2. Finance 41 %
3. Marketing 34 %
4. Production 29 %
5. Warehousing & Logistics 27 %
Marketing has the largest potential compared to how it’s being used today. IT and Procurement & Sourcing are the business areas with lowest potential.
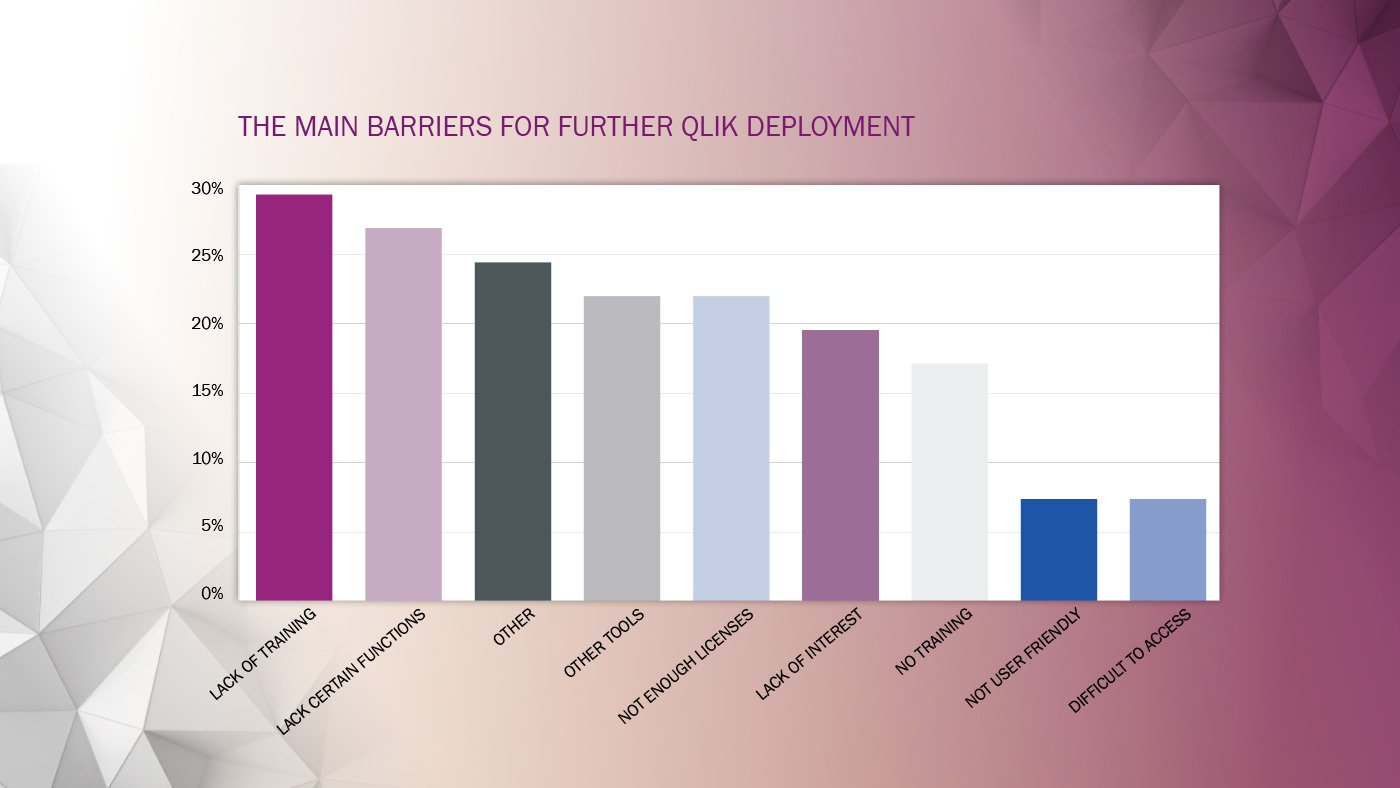
Barriers for further Qlik deployment
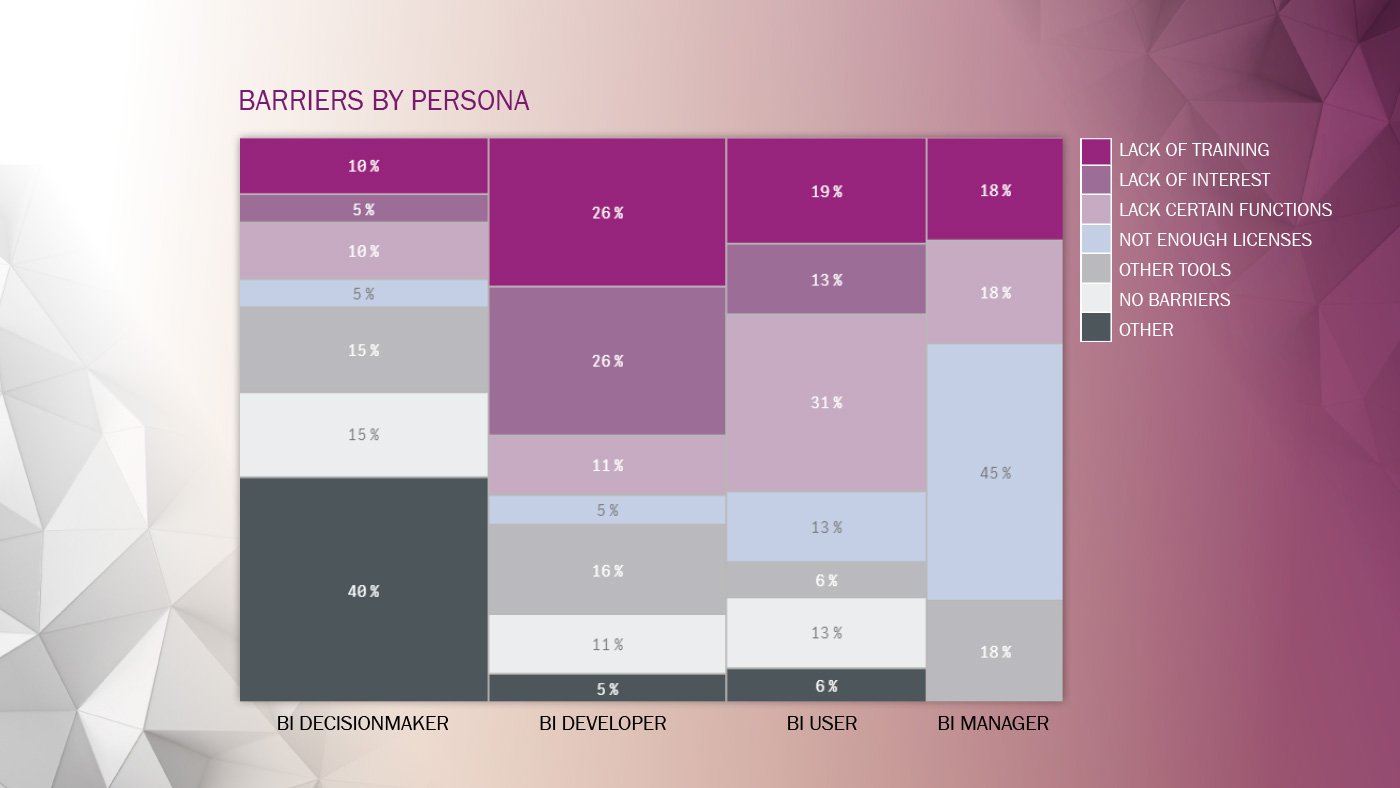
The top 5 main barriers for further Qlik deployment are:
1. 29 %, consider Lack of training to be the main barrier.
2. 27 % answered Lack of functions.
3. 24 % answered Other and commented that costs of development and licenses, infrastructure, the internal approval process and other project processes were the barriers.
4. 22 % said that they do Not have enough licenses.
5. 20 % answered Lack of interest.
The main barrier varies depending on who you ask. The decision-makers consider the costs to be the main barrier, compared to the developers who see training and lack of interest as the main barriers. According to the users the Qlik solution lacks functions and the BI Managers see a need of more licenses
ENABLERS THAT WOULD INCREASE DEPLOYMENT OF QLIK
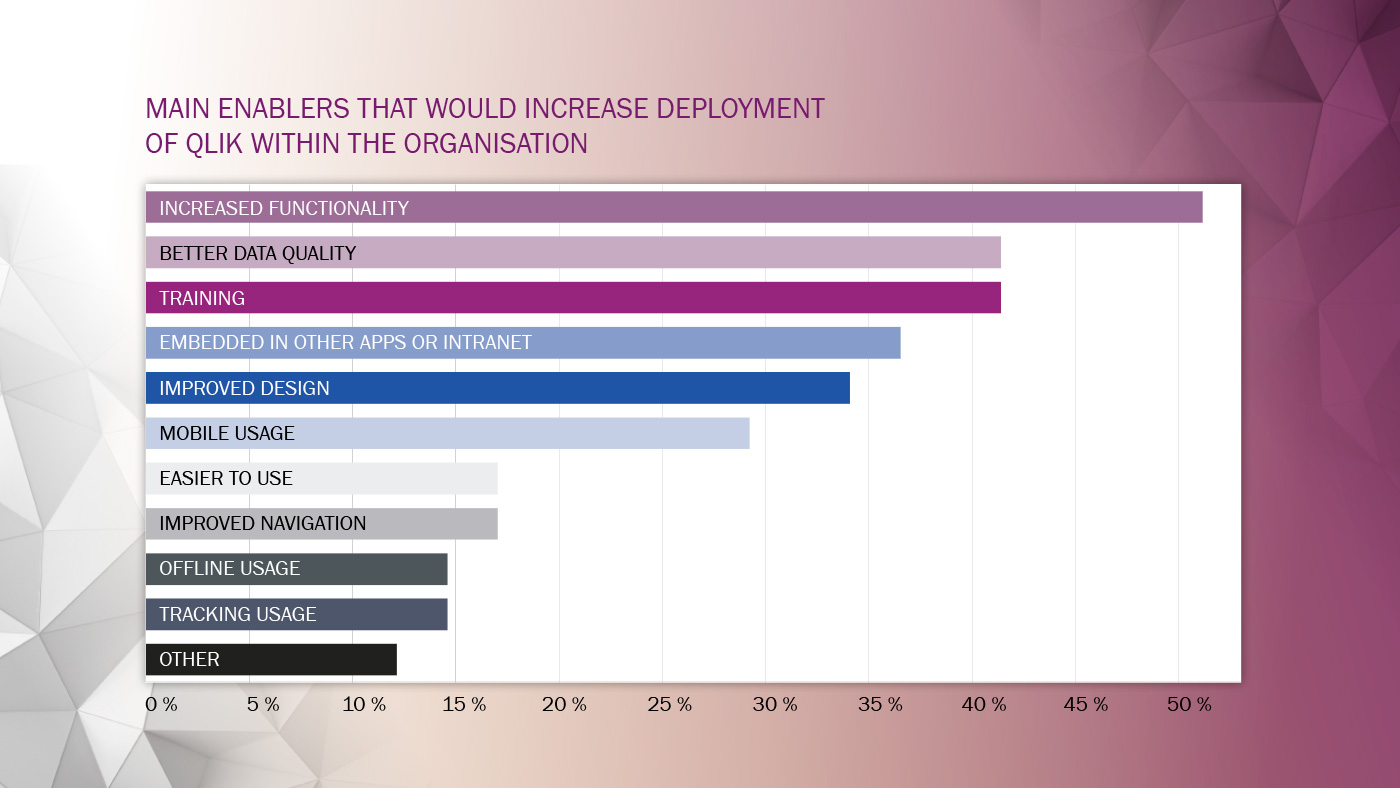
The top 5 main enablers that would increase deployment of Qlik within the organisation are:
1. Increased functionality 51 %
2. Better Data Quality 41 %
3. Training 41 %
4. Embedded in other apps or intranet 37 %
5. Improved design 34 %
»Business Intelligence ROI: Hard to calculate, but very real.«
Four key steps to up BI usage in your organisation
1. Measure usage!
You have x number of licenses but how many are actually using your BI solution? When? For what? And how? The first step towards increasing usage is of course to find out if, how and by whom BI is being used to uncover any usage barriers and decide what do to about them. We’ve developed a Qlik Sense application that will help you map out how the tool is being used and if it supports the employees as intended. With it, you will be able to follow up on: frequency of use; number of logins, when and by whom, usage patterns; trends over time; and much more.
Find out more by contacting us today to try our Qlik Sense application!

2. Provide training & support
It’s easy to think that all the hard work is done once you’ve launched your BI solution. The truth is that implementation is challenging and the work has just begun. People are busy and will prioritise tools that give them instant value. Therefore, training, both in the beginning and over time, is crucial. At Climber, we can help you with:
- Basic Qlik training: Get familiar with the tool, how to navigate and the different features.
- Tailor made training: Training in your specific applications. What’s the idea behind them, the setup of the solution and the connections between the sheets, the features and shortcuts?
- Open House: When the solution is being used, that’s when you start to get the most important feedback. Hands on support, onsite or remote, when the users are stuck, may be the key to increasing usage and getting valuable feedback on how to improve the user experience.
Learn more about our different training sessions here. Sound interesting? Get in touch here and we’ll get back to you.
3. Add more functionality
Are you using Qlik to gather data and then exporting it back to Excel for further analysis? Lack of functionality in Qlik is often seen as the main barrier for end users. The problem could simply come down to the fact that more training is needed. However, many users would like to be able to use their Qlik-based BI tool for other types of analysis as well. It’s all about understanding user needs and facilitating self-service to help them keep using the tool and getting to know just what it is capable of.
Extensions for Qlik Sense is a smart way to extend the functionality in Qlik and make the tool even easier to use. Do your users export to Excel and analyse their data there instead? The Custom Report extension for Qlik will help make the analysis easier and side-step the need to export to excel! Check out our different Qlik Sense extensions here.

4. Enhance user experience
The key to boosting usage of any tool is to enhance user experience. Did you know that you can measure user experience as well? It’s known as the SUS score and measures perceived usability of your BI solution. In a usability study, we will help you go over your applications. The study is based on an anonymous test, targeting users on different levels, asking them to perform certain tasks to find out how the applications can be improved in terms of navigation, design and functionality to increase usage. If you are thinking of changing from QlikView to Qlik Sense, this is an excellent opportunity to find out what you should consider when recreating or building new applications.
Want to do a usability study on a specific application or your entire solution? We will customise a study for you. Get in touch!
We help you boost data literacy and BI self-service among employees
Are you new to Qlik or want to increase BI engagement within your organization? Climber can help you with both complementing your existing BI platform with new layers of end-user self-service data discovery tools, and by providing training to help employees understand what data is available and how to use it to make data-driven decisions. Sounds interesting? Fill out the form below or contact us!
Questions? Contact us!
Do you want to know more about the results of the Qlik Usage Survey? Should you have any questions or require further information, please contact us!
Erica Lenksjö
Marketing Director
erica.lenksjo@climber.fi
+46 72 352 35 09
Jussi Saarinen
Managing Director
jussi.saarinen@climber.fi
+358 40 756 7340